概览
描述
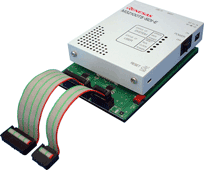
This model supports SDI-1, SDI-2 and newly developed SDI-3. And it is a high-end model which has full emulator-like debugging functions such as real-time trace. This model is advanced type which provides enhanced debugging features compared to the already-existing M32100T3-SDI-E.
特性
- Also SDI-3 (new SDI specifications) support
- Became more compact (About the same size as a probe the earlier M32100T2-SDI-E)
- Power supply range: 100 to 240 V (50/60Hz)
- An MCU on the target board can be controlled by adopting JTAG mode
- Break, trace, and time measurement functions
- Real-time trace of 192KB (Approx. 30000 steps) Note1
- Easy-to-use emulator debugger M3T-PD32RM bundled
Note
- Depending on the model of target MCU, an optional converter for in-circuit connection may be required depending on your target MCU.(Refer to "Optional products".)
发布信息
M3T-PD32RM
Latest Ver.: V.3.01 Release 00
Released: Oct 1, 2006
Details of upgrade (See Tool News)
Operating Environment
目标设备
Additional Details
Device Function
Debugger (Software):M3T-PD32RM
The M3T-PD32R emulator debugger supports:
- M32100T5-SDI-E (Discontinued product)
- M32100T3-SDI-E (Discontinued product)
- M32100T-EZ-E
- Easy operations with overlapping multi-windows and GUI
- Comfortable debugging environment provided by drag & drop operation
- C language and assembly language source level debugging and many other basic debug features
- Real-time OS support
- Real-time RAM monitoring
- Real-time tracing, Time measurement and other advanced features (Unsupported in some instances)
- Creating user-defined windows and commands
- On-line help in HTML
- You can customize the M3T-PD32RM by using a programming tool such as Microsoft Visual C++ or Visual Basic (the PDSDK COM kit required). For example, you can create a user-defined window and interface between the M3T-PD32RM and other COM-compliant applications.
- Operating Environment:IBM PC/AT compatibles (Windows® XP, Windows® 2000)
- Basic Functions
| Window | Function |
|---|---|
| PD32RM Window | Controls entire debugger. You can perform the following basic debugging commands by using the tool bar buttons: program execution/stop, step execution, execution up to cursor position, and break point setting/cancel. You can also open various other windows from this window. |
| Program Window | Displays the program. Source code is editable here. Matching address line is displayed in color for the program counter (PC). You can select display format from among "source", "disassemble" or "mixed". You can also set or cancel break points. |
| Source Window | Displays the designated place of a program. Source code is editable here. Unlike the program window, you can open more than one window. The window is displayed continuing a certain function or task, and is convenient when break points have to be set and canceled repeatedly. |
| Register Window | Displays/changes content of flags and registers particular to the MCU. |
| Memory Window | Displays the contents of contiguous memory in dump format with "address" and "label". Can be displayed in binary, decimal, hexadecimal, and ASCII. Allows to modify the contents of memory, and also to fill and move specified blocks of memory. |
| ASM Watch Window | Monitors changes in memory content and variable content declared on the assembly language level. Display format can be selected from among binary, decimal, and hexadecimal. |
| C Watch Window | Displays C variable content. In addition to a window that displays variable formula of your choice, there are windows that display external variables, local variables within a file, and local variables within a function. |
| Call Stack Window | Displays function call information of C language. |
| Script Window | Window for executing commands from the keyboard or script files. An area is provided for displaying command execution results and command history. Execution results can be output to a file. |
| S/W Break Point Setting Window | For setting/canceling software break points. Can set 64 break points maximum (OR condition). |
图像
- Advanced Functions
| Window | Function |
|---|---|
| Trace Point Setting Window * Available for M32100T5-SDI-E and M32100T3-SDI-E. |
Sets/clears trace points. As a condition, combination of 6 trace points and each event can be set. |
| Trace Window * Available for M32100T5-SDI-E and M32100T3-SDI-E. |
Displays the results of real-time tracing in the emulator. The following three display modes are supported: Bus mode, Disassemble mode and Source mode. Those modes can be used concurrently. |
| Data Trace Window * Available for M32100T5-SDI-E and M32100T3-SDI-E. |
Graphically shows the data access information on the results of real-time tracing. |
| Task Trace Window * Available for M32100T5-SDI-E and M32100T3-SDI-E. |
Graphically shows task execution histories of programs using real-time OS. |
| Task Analyze Window * Available for M32100T5-SDI-E and M32100T3-SDI-E. |
Shows the results of statistical processing of measured data within the range specified with the Task Trace Window. This window shows the occupancies of tasks in a CPU. |
| MR Window | Shows the state of the real-time OS M3T-MR32R. |
| MR Trace Window | Graphically shows task execution histories of programs using the real-time OS M3T-MR32R (V.3.10 or later). Also, each history of interrupt handling and system call issuing is shown together. |
| MR Analyze Window | Shows the results of statistical processing of measured data in the range specified with the MR trace window. And shows the list of the following records : the occupation status per interrupt handler or task, history of system call issuing. |
| Time Measurement Window * Available for M32100T5-SDI-E and M32100T3-SDI-E. |
Sets time measurement conditions and references the measurement results. As the measurement results, the execution time (Max, Min, Average) and the measurement count are displayed. The number of measurement points are as follows : M32100T5-SDI-E : Up to four points M32100T3-SDI-E : One point |
| GUI Input Window | Shows key input panels of user target system. You can make virtual key input buttons by simple mouse operation. While the program is running, pressing the button generates data input. |
| GUI Output Window | Shows output panels of user target system. You can make virtual output LEDs or labels by simple mouse operation. |
图像
Screen Image : Advanced Windows for the Emulator (1/2)
图像
Screen Image : Advanced Windows for the Emulator (2/2)
Specifications
| Item | Description | |
|---|---|---|
| MCU supported | M32R Family M32R/ECU Series :
|
|
| Emulation memory capacity | MCU with built-in flash ROM used as emulation memory. Note1 | |
| Software break | Implemented by internal resource of MCU or instruction replacement. Note1 | |
| Hardware break | Forcible break | Implemented by internal resource of MCU Note1 |
| Data access break | Implemented by internal resource of MCU Note1 | |
| Real-time trace Note2 | Memory size | 192 KB Note3 |
| To be recorded | Information of branching address/data access, time stamp | |
| Recording mode | About 192KB from starting execution About 192 KB up to stopping execution About 192 KB from event About 192 KB up to event About 192 KB of before and after event |
|
| Trace recording event | Detects events based on the branching address/data access | |
| Time measurement Note2 | Measurement | Measures 4 intervals (max./min./number of passing) |
| Time measurement event | Detects events based on the branching address/data access | |
| PC Interface | USB 2.0, High-speed | |
| Connection type for target board |
|
|
| Target I/F |
|
|
| Target host PC (OS) | Refer to Operating Environments of Products. | |
| Power supply | Supplied from the included AC adapter | |
| External dimensions (main body) | Width | 92 mm |
| Depth | 140 mm (including M32RT2-CNV) | |
| Height | 35 mm (including M32RT2-CNV) | |
| Weight | 260 g | |
| Ambient environment condition (When operating) | Temperature, humidity | 5 to 35 oC, 20 to 80% |
| Dust and dirt | General office environment | |
| Ambient environment condition (When stored) | Temperature, humidity | 10 to 60oC, 0 to 90% |
| Dust and dirt | General office environment | |
| Overseas standards | European Standards: EN 55022 Class A,EN 55024 US FCC Standard: FCC part 15 Class A |
|
Notes
- Depends on the MCU specifications.
- Enabled only when the MCU has an SDI trace interface and the SDI trace interface cable has been connected. Because the emulator debugger automatically judges the status of connection to the target board, disabled functions cannot be selected from the menu.
- The number of cycles which can be recorded varies depending on what the emulator traces. An estimated number of cycles is 3000.
- An optional converter for in-circuit connection may be required depending on your target MCU. (Refer to "Optional products".)
Components
- M32100T5-SDI-E (Emulator main unit)
- M32RT2-CNV (SDI interface cable connection board)
- USB interface cable (1.8m)
- SDI MCU control interface cable (10-pin 1.27-mm-pitch flat)
- SDI trace interface cable (20-pin 1.27-mm-pitch flat)
- AC adapter
- AC power cable for Japan (3m)
- Emulator debugger M3T-PD32RM (CD-ROM)
- User's manual
Note: When using this emulator outside Japan, use AC power cable which complies with the safety standard of the country.
System Configuration
图像
Optional product
| Target MCU | Converter for in-circuit connection |
|---|---|
| M32176FxxFP | M32176T-PTC (Discontinued) |
| M32185FxxFP (Under development) |
M32186T2-PTC |
| M32186FxxFP | M32186T2-PTC |
| M32192FxxFP (Under development) |
M32192T2-PTC |
| M32195FxxFP (Under development) |
M32192T2-PTC |
| M32196FxxFP | M32192T2-PTC |
| M32170FxxFP M32174FxxFP (Discontinued) |
M32170T-PTC (Discontinued) |
| M32171FxxFP (Discontinued) |
M32171T-PTC (Discontinued) |
| M32172FxxFP M32173FxxFP (Discontinued) |
M32173T-PTC (Discontinued) |
| M32182FxxFP (Discontinued) |
M32182T2-PTC (Discontinued) |
| M32180FxxFP (Discontinued) | M32180T2-PTC (Discontinued) |