概览
简介
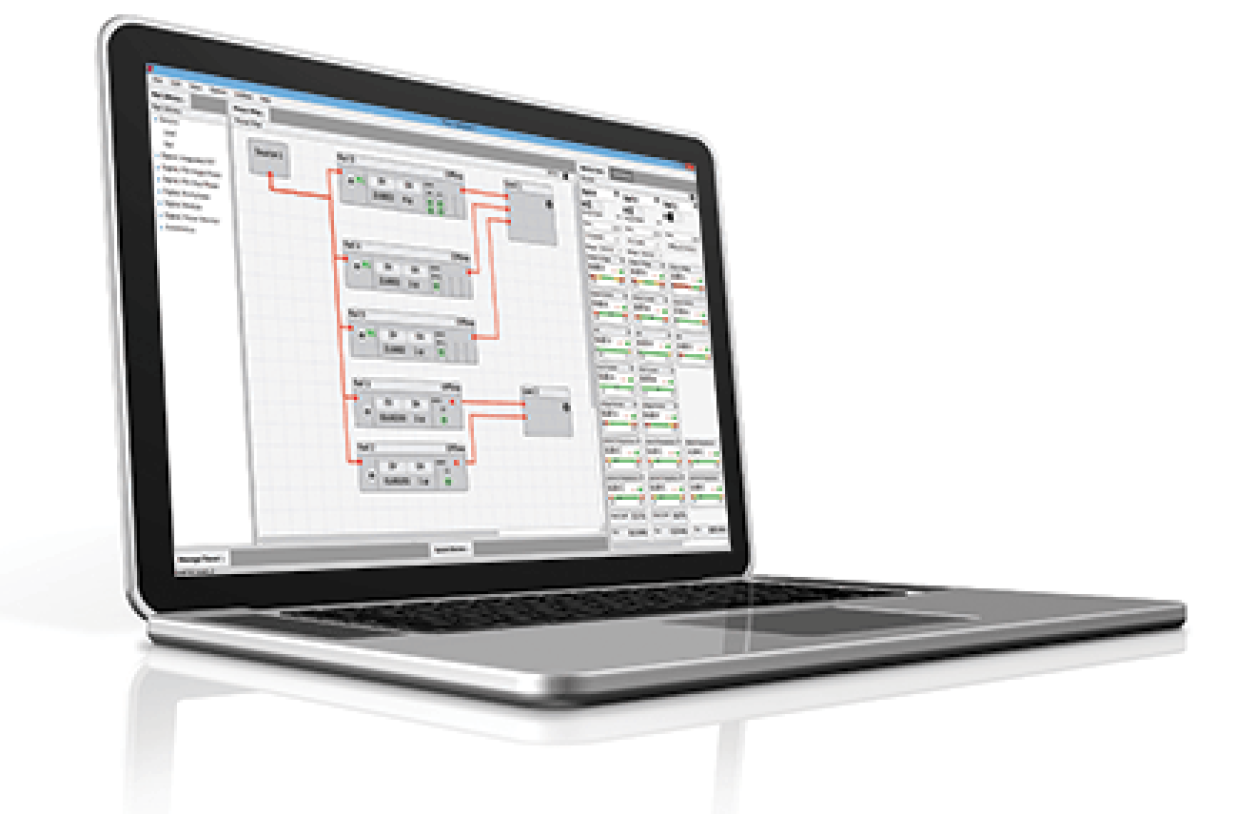
瑞萨电子的 PowerNavigator™ 软件可使用带 USB 接口的 PC 对多个数字直流器件进行简单配置和监控。 PowerNavigator 还可利用简单的图形用户界面使更改数字电源设计的所有特性和功能更为容易。
什么是生产配置工具?
生产配置工具(PCT)可在瑞萨数字电源控制器/模块中快速加载和验证配置文件。
标准配置文件和 HEX 生产文件均可使用。 PCT 将加载并验证任一种格式。
生产配置工具的功能
- 同时编程或验证配置多个器件
- 支持 PowerNavigator 支持的所有器件
- 将数据记录到 error.txt 文件
发布信息
PowerNavigator 5.4.113 到 5.4.139 新增了哪些功能?
新增功能
增加了对以下内容的支持:
- ISL8280M, ISL8282M*
- RAA210833, RAA210850, RAA210870, RAA210925
- ISL91212A, ISL91212B, ISL91301A, ISL91301B, ISL91302B
*PowerNavigator 会将 ISL8280M 或 ISL8282M 产品检测为单一产品类型,该类型称为 ISL828xM。
系统要求
- 32 位或 64 位 Windows® Vista、Windows® 7、Windows® 8 或 Windows® 10
- 最小屏幕尺寸:1024 x 768px
在生产环境中工作? 您需要使用生产配置工具。
配套产品
- 集成 FET 数字稳压器:
ZL2101、ZL2102 - 数字控制器:
ISL68200、ISL68201、ISL68300、ISL68301、ZL6105、ZL8101、ZL8800、ZL8801、ZL8802 - 数字多相:
ISL6388、ISL6398、ISL68124、ISL68127、ISL68134、ISL68137、ISL68144、ISL68147、ISL69122、ISL69124、ISL69125、ISL69127、ISL69128、ISL69133、ISL69134、ISL69137、ISL69138、ISL69144、ISL69147、ISL69158 数字模块:
ZL9006M、ZL9010M、ZL9101M、ZL9117M、ISL8270M、ISL8271M、ISL8272M、ISL8273M、ISL8274M、ISL8277M、ISL8278M、ZL9024M、RAA210833、RAA210850、RAA210870、RAA210925、ISL8280M、ISL8282M请注意,PowerNavigator 不支持 ISL8210M 和 ISL8212M。 这些器件没有数字控制总线,因此不需要 PowerNavigator 的支持。
- 数字电源监视器:
ISL28023、ISL28025 - 电源管理 IC:
ISL91212A、ISL91212B、ISL91301A、ISL91301B、ISL91302B - 汽车:
ISL78229
目标设备
文档
|
|
|
---|---|---|
类型 | 文档标题 | 日期 |
指南 | PDF 4.68 MB | |
手册 - 开发工具 | PDF 5.52 MB | |
指南 | PDF 714 KB | |
应用文档 | PDF 1.08 MB | |
手册 - 硬件 | PDF 693 KB | |
5 items
|
视频和培训
Learn the basics about the monitoring and sequencing views and how to customize your display.
Transcript
In this video, I'll give you a quick overview of some of the high level functions and benefits of the PowerNavigator GUI. And then, in subsequent videos, we'll deep-dive on each function and show you how to set up and configure that parameter. So let's take a look at the starting point.
So we can see on the screen here is a typical system we've put in place with three different devices, three different output voltages for, let's say, a core voltage, a memory and an I/O rail. So what you've got is the ability to view the entire system from a power architecture standpoint, what rails are set up, what's the input voltages coming through, and how the devices cascade in the system.
On the left side we've got the monitoring screen up, that way you can monitor every single rail. Now, these panels are configurable. You can go through and select what you want to see at a screen at any point in time. So let's take a look at how the monitoring screen works. So the tab on the left shows that we're viewing the monitoring, and you can see the three rails are powering up. The tab on the left shows the monitoring view, so what we can see now is the system display for the three different rails that we have in the system. Looking from the top to the bottom as we walk our way through it, you can see we've got what the output voltage is set to, how the device is configured, to either use enable pin or PMBus enable.
And then you've got the displays. So these are graphical displays using an analog meter to show you what the output voltage is, the output current, input voltage, and also, if the device has it, the input current. At the bottom you've got the ability to manage your temperature. With all these devices, there's a temp sensor internal to the device that measures the junction temperature of the silicon and also the ability to use an external temperature monitor if you want to compensate for, say, the DCR variation of the inductor. At the very bottom, it gives you the run time specifics of duty cycle and frequency.
So right now you can see everything is set to zero because we're not connected to any hardware. One of the big enhancements with this version of PowerNavigator is the ability to configure the display. So right now it's a vertical view. We can go to a dashboard view from a horizontal. We can select what information you want to see in that. The benefit of this is, if you have a large system with maybe 30 to 40 rails, you can display every single power supply on one page. It's easily identifiable in terms of color coding, whether the device is operational or a fault has occurred. Worst case condition, if a fault occurs on a single rail, you can also go in to the fault status page as shown here in the left tab.
Clicking on this pulls up a fault screen, and right away you can pinpoint the exact problem with that power supply rail, whether it's something like an overvoltage condition, overcurrent, or maybe the input voltage hasn't been applied. The last page here is the sequencing tab. When you go into sequencing, now you have a graphical representation of what the device does during power up or power down. And then you've got the ability to sequence the rails, so you can sit there and drag and drop. So with a single mouse click, I can take this rail and I can change the soft-start time. I can also change the timing. So you want a time-based sequencing? I can delay one rail with respect to another. If you know all your parameters, you can also type them in quickly to set up the different timing patterns.
In some later videos, I'll show you some of the other benefits behind the sequencing and the monitoring views, and also how you set up the projects. Please continue watching, and we'll go through detail on each one of these functions.