
"People who advocate simplicity have money in the bank; the money came first, not the simplicity."
– Douglas Coupland, The Gum Thief
Accelerometers and vibration sensors are having their day. As prices have come down drastically, we are seeing more and more companies instrumenting all kinds of devices and equipment. Industrial, automotive, and consumer products use cases are proliferating almost as fast as startups with "AI" in their names.
In many cases, particularly in industrial applications, the purpose of the new instrumentation is to monitor machines in new ways to improve uptime and reduce cost by predicting maintenance problems before they occur. Vibration sensors are an obvious go-to here, as vibration analysis has a long history in industrial circles for machine diagnosis.
We see our industrial customers trying to get results from all kinds of sensor implementations. Many of these implementations are carefully engineered to provide reliable, controlled, ground-truthed, rich data. And many are not.
Working with accelerometers and vibrations
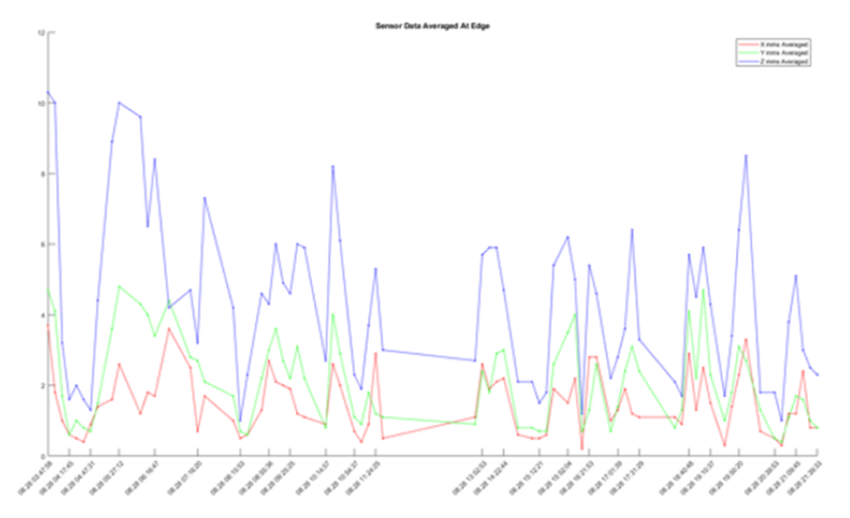
In vibration data, there are certainly things you can detect by just looking at how much something shakes. To see how much something is shaking, one generally looks at the amplitudes of the movement and calculates the amount of energy in the movement. Most often, this means using measures of vibration intensity such as RMS and "Peak-to-Peak". Looking at changes in these kinds of measures can usually determine whether the machine is seriously out of balance, for instance, or whether it has been subject to an impact.
For more subtle kinds of conditions, like identifying wear and maintenance issues, just knowing that a machine is shaking more isn't enough. You need to know whether it's shaking differently. That requires much richer information than a simple RMS energy. Higher sample rates are often required, and different measures.
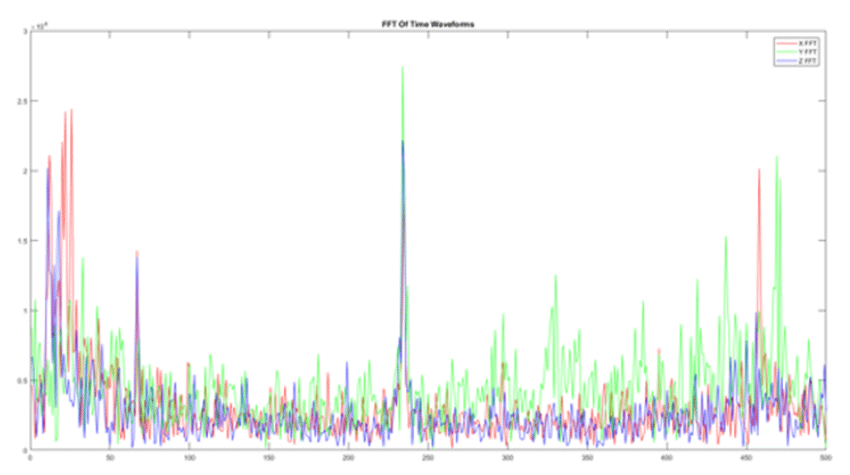
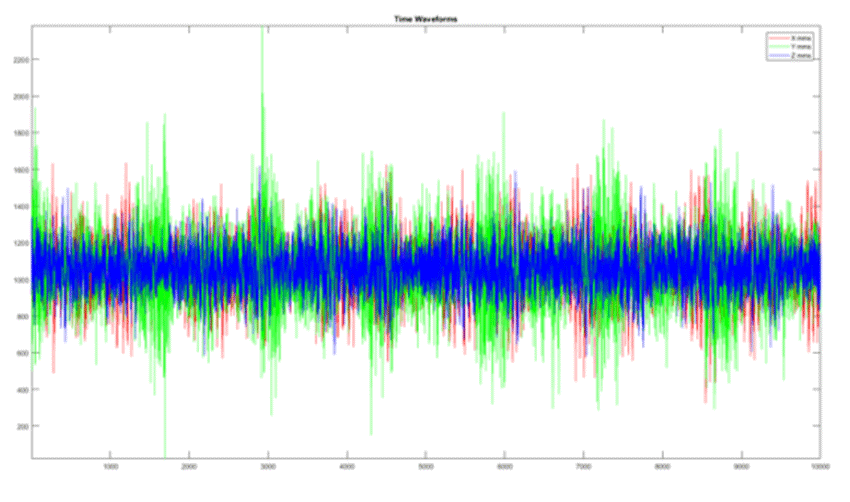
Trained vibration analysts would generally go to the Fast Fourier Transform (FFT) to calculate how much energy is present in different frequency bands, typically looking for spectral peaks at different multiples of the rotational frequency of the machine (for rotating equipment, that is; other kinds of equipment are more difficult with Fourier analysis). Other tools, like Reality AI, do more complex transforms based on the actual multidimensional time waveforms captured directly from the accelerometer.
But rich data brings rich problems – more expensive sensors, difficulty in interrupting the line to install instrumentation, and bandwidth requirements for getting data off the local node.
Many just go with the cheapest possible sensor packages, limit themselves to simple metrics like RMS and Peak-to-Peak, and basically discard almost all of the information contained in those vibrations.
Others use sensor packages that sample at higher rates and compute FFTs locally with good frequency resolution, and tools like Reality AI can make good use of this kind of data.
Some, however, make the investment in sensors that can capture the original time-waveform itself at high sample rates, and work with tools like Reality AI to get as much out of their data as possible.
It's not overkill
But I hear you asking "Isn't that overkill?"
Do I really need high sample rates and time-waveforms or at least hi-resolution FFT? Maybe you do.
Are you trying to predict bearing wear in advance of a failure? Then you do.
Are you trying to identify subtle anomalies that aren't manifested by large movements and heavy shaking? Then you do too.
Is the environment noisy? With a good bit of variation both in target and background? Then you really, really do.
Rich Data, Poor Data
Time waveform and high-resolution FFT are what we describe as "rich data." There's a lot of information in there, and they give analytical tools like ours which look for signatures and detect anomalies a great deal to work with. They make it possible to tell that, even though a machine is not vibrating "more" than it used to, it is vibrating "differently."
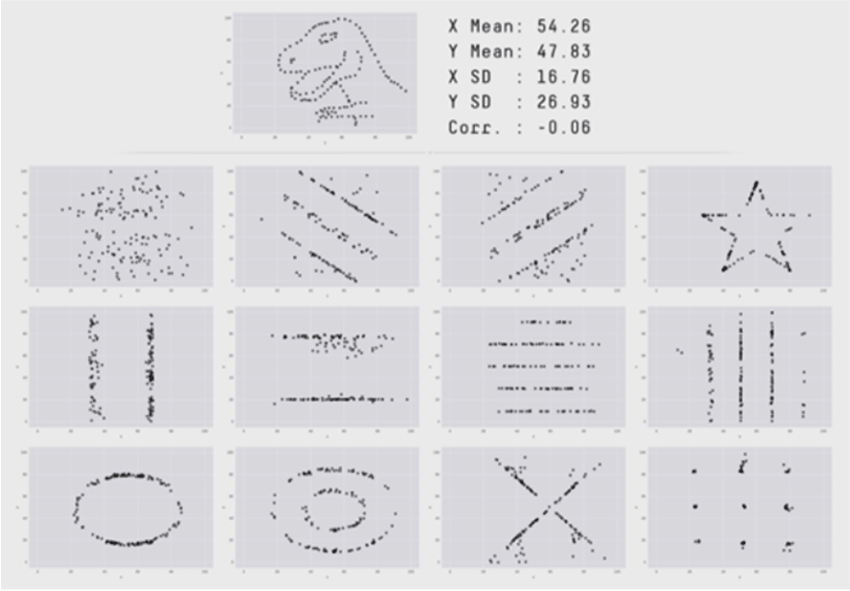
RMS and Peak-to-Peak kinds of measures, on the other hand, are "poor data." They don't tell you much and discard much of the information necessary to make the judgments that you most want to make. They're basically just high-level descriptive statistics that discard almost all the essential signature information you need to find granular events and conditions that justify the value of the sensor implementation in the first place. And as this excellent example from another domain shows, descriptive statistics just don't let you see the most interesting things.
In practical terms for vibration analysis, what does that mean?
It means that by relying only on high-level descriptive statistics (poor data) rather than the time and frequency domains (rich data), you will miss anomalies, fail to detect signatures, and basically sacrifice most of the value that your implementation could potentially deliver. Yes, it may be more complicated to implement. It may be more expensive. But it can deliver exponentially higher value.