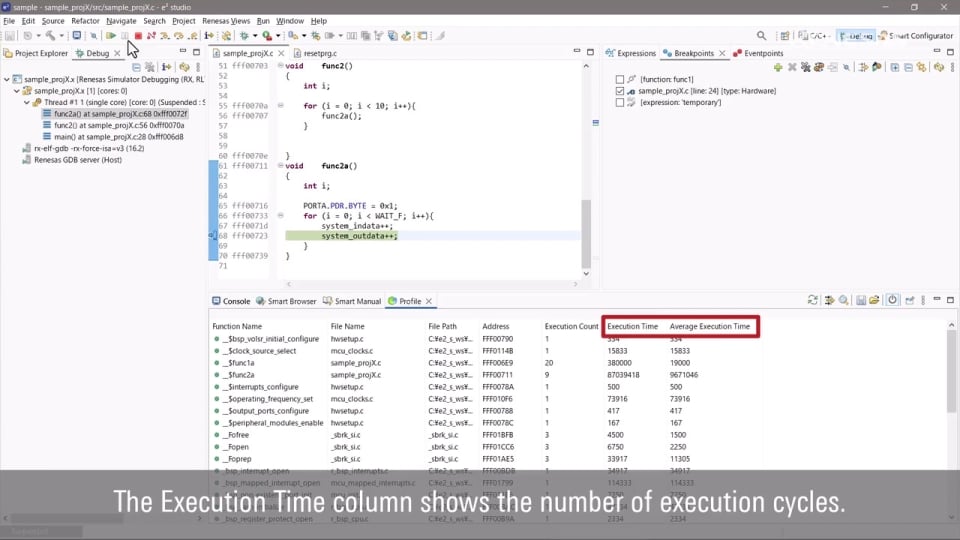
This video demonstrates how to use the Profile view in e² studio to check the execution time and number of executions for each function during debugging.
Related Resources